Job output
A simple QEMU job page will look like this:
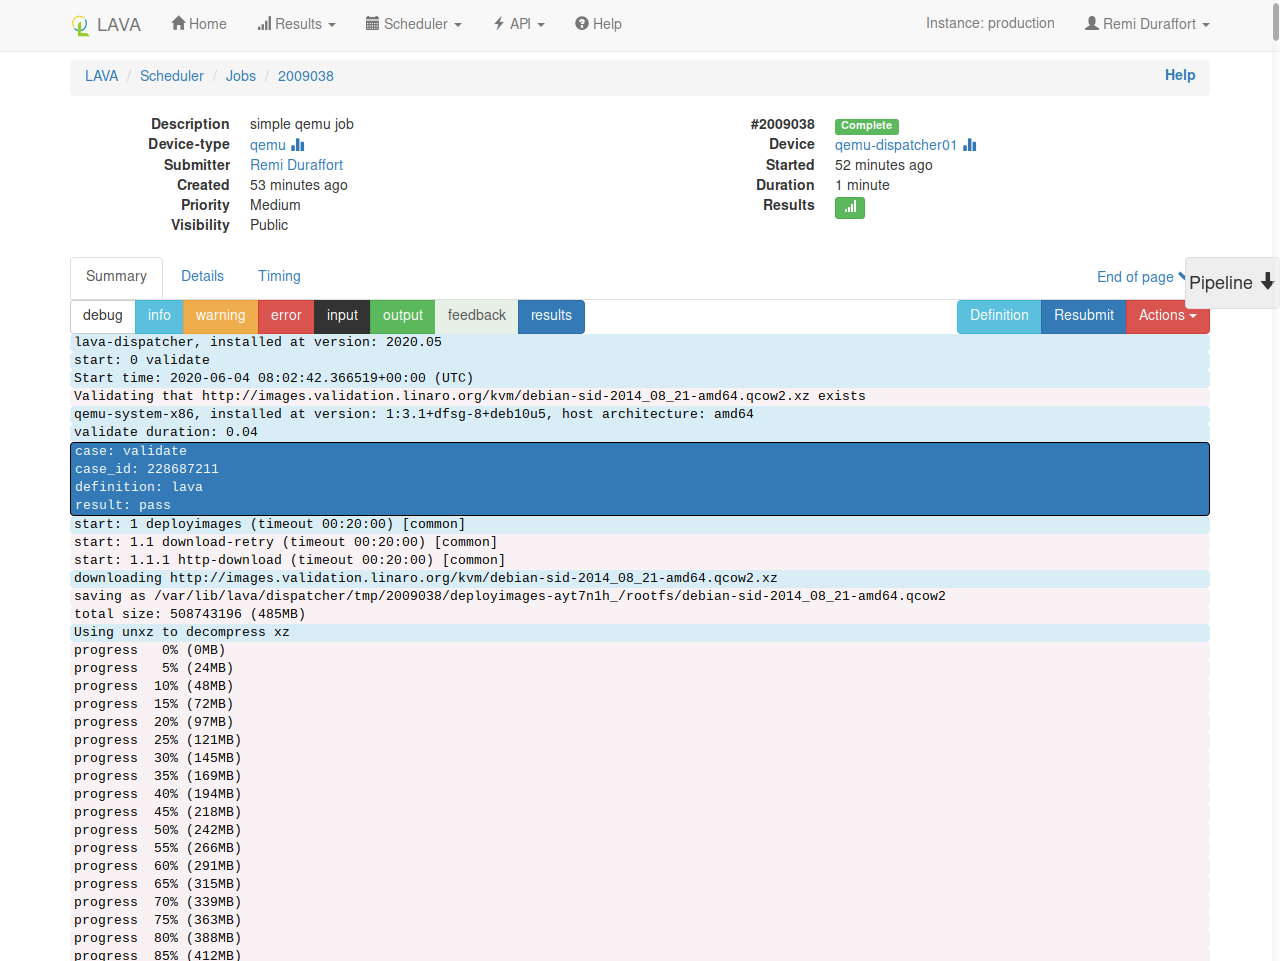
Header
At the top of the page, job meta-data are listed in two columns:
- static data on the left (description, device-type, submitter, ...)
- dynamic data on the right (job id, actual device, duration, ...)
Summary
This is the main tabular as it includes the logs of the job.
You can select the levels that should be displayed or hidden by clicking on the corresponding buttons:
debug,info,warninganderror: LAVA logsinput: DUT inputtargetandfeedback: DUT outputresults: LAVA results
target vs feedback
Both target and feedback are DUT output.
When using namespaces, DUT
output for the current namespace will be in target while outputs coming
from over namespace will be in feedback.
Pipeline
On the right side of the page, the pipeline element allows you to jump
directly at the log of a specific action of the pipeline.
Details
In this tabular, you have access to the internal details of the LAVA pipeline that was running for this specific job definition.
Timing
This tabular list each individual action with it's duration along with its timeout.
This helps test writers to check for actions with a duration which is much shorter than the requested timeout. Reducing these timeouts will allow failures to be identified more quickly.
The graph only shows actions that are longer than 1 second. The full list is available in the table.